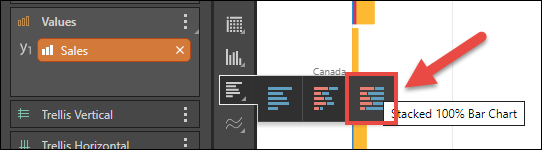
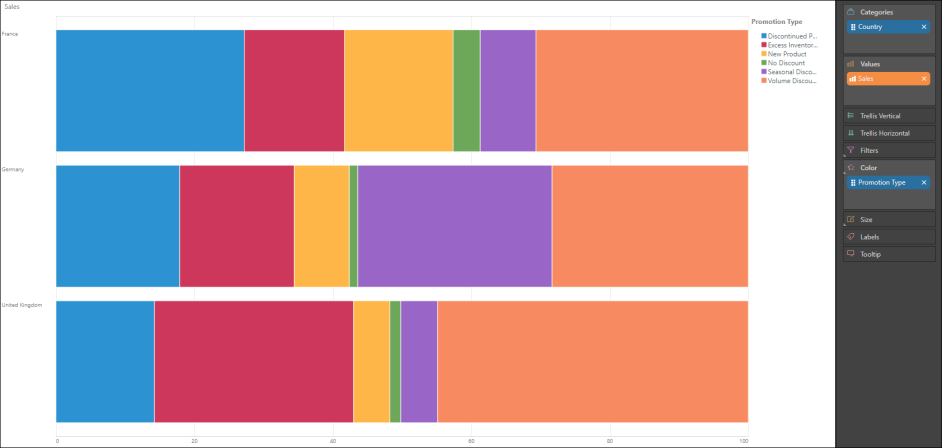
The Stacked 100 Bar Chart functions the same was as the Stacked 100 Column Chart; the difference is that the member hierarchy in the Categories zone is on the y-axis, and the measure in the Values zone is on the x-axis.
Build a Stacked 100 Bar Chart
To build a stacked 100 column chart, follow that same steps required to build a stacked column chart, but be sure to select Stacked 100 Bar Chart at Step 2 (red highlight below).